Whether you’re a seasoned property investor or looking to buy your first home, you’re probably aware of the importance of knowing when to buy or sell. You could say to yourself, “it doesn’t matter, it will go up in value eventually”, but you could be missing out on the chance to maximise your wealth more effectively.
Just think, if you bought a Sydney property when it was at a peak in 1989, the subsequent drop would mean that on average, you’d have to wait for 7 nail-biting years before it returned to your purchase price. If you’d bought in Brisbane instead, for less than half the value of Sydney, average property prices would have grown nearly 70% in the same amount of time. Understanding property cycles is the key to knowing when that golden period of opportunity might be coming up.
What is the property cycle?
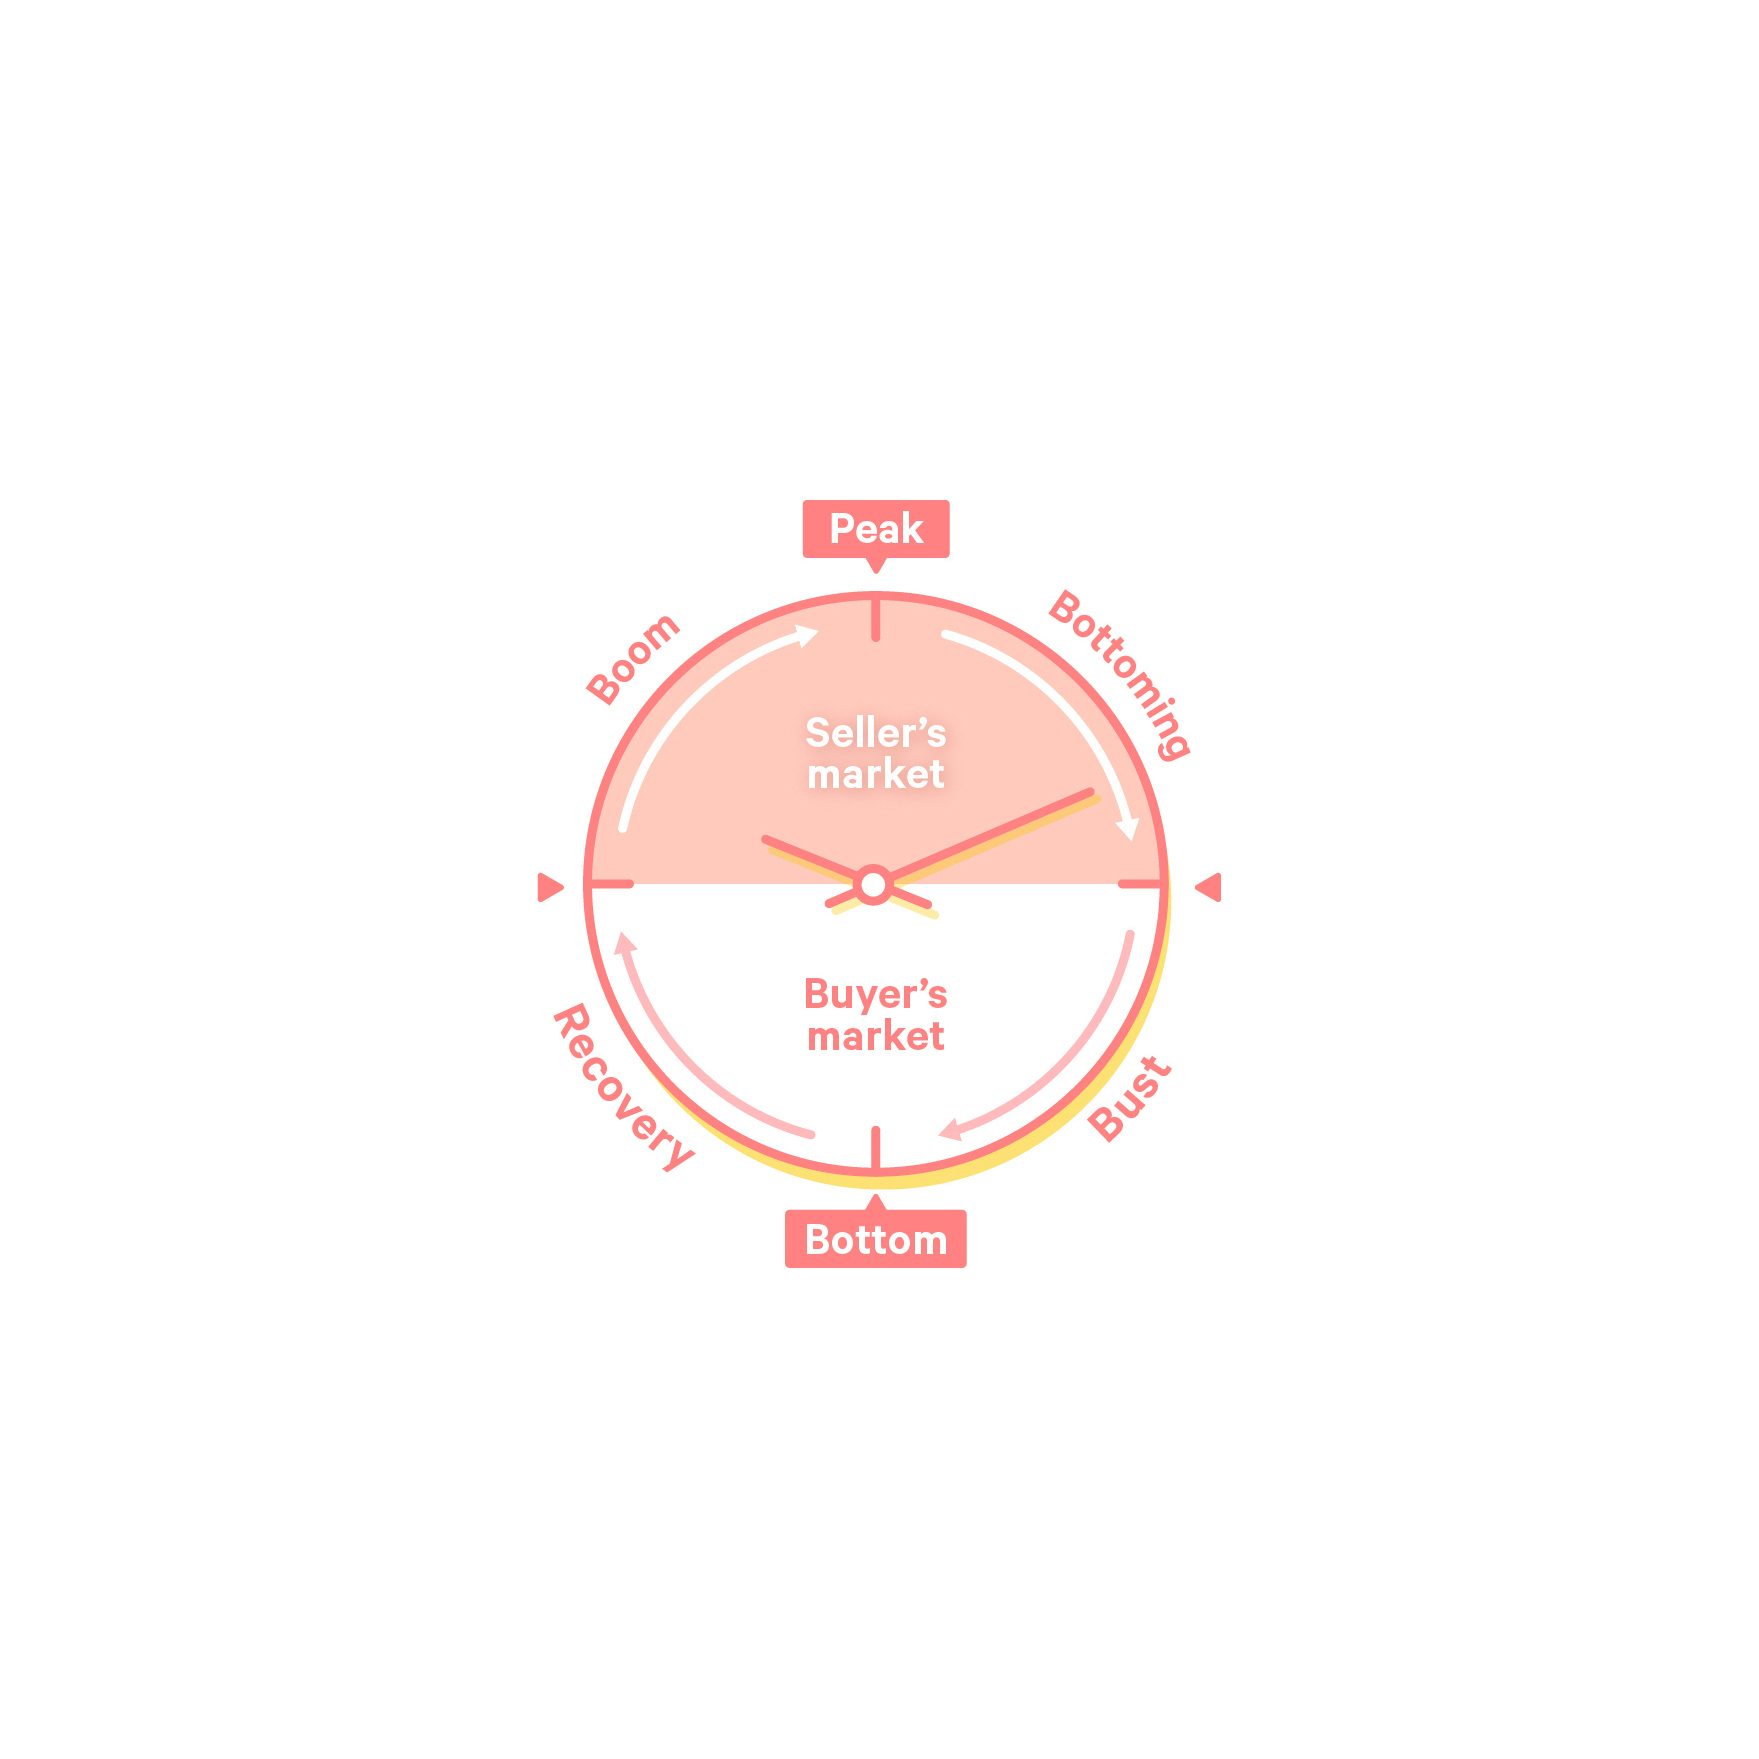
Like many investments, property markets generally go through cycles during which house prices may shift up and down. We can visualise this movement with a handy tool – the ‘property clock’:
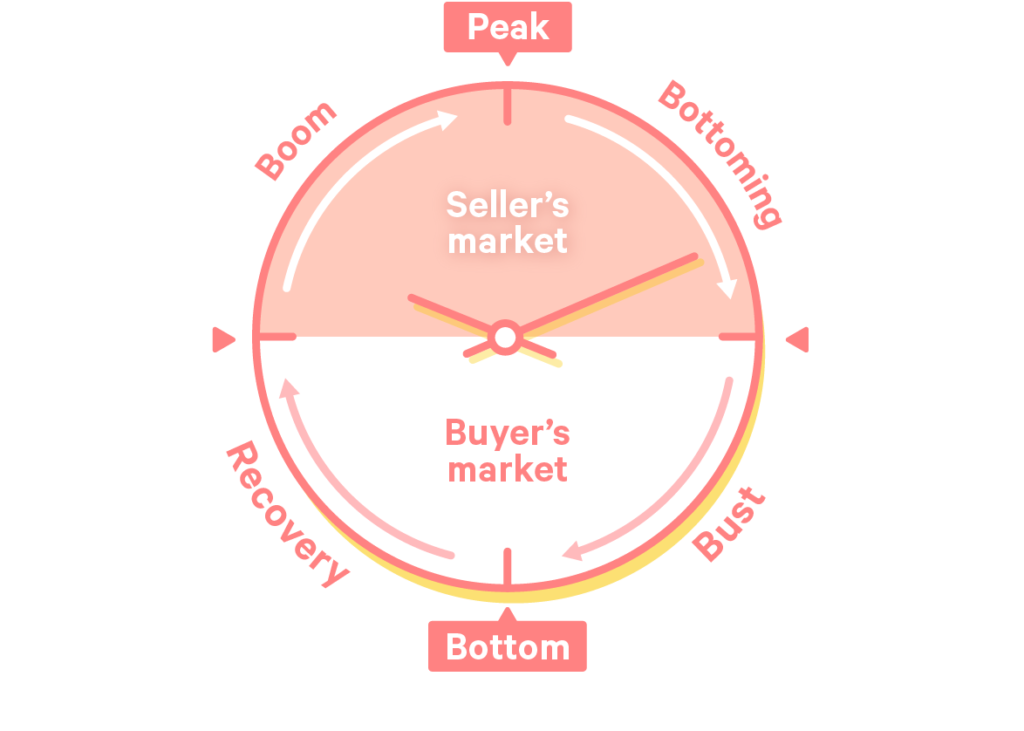
Even though we’re visualising market movement on a clock, keep in mind that the phases aren’t actually time-bound so one phase could last longer than another depending on that particular cycle’s conditions.
On a high level though, there are 4 phases in a property cycle: boom, bottoming, bust, and recovery. Boom times, also known as the ‘seller’s market’, is a period of invigorated buyer confidence. Demand outpaces supply even as developers rush to snatch up more building approvals. Before construction actually commences, demand continues increasing until prices grow to a point where they’re no longer affordable. This is where the property clock strikes 12 and we’ve reached the peak of the market. From here, prices fall, the market is oversupplied and cools until reaching the bottom at “6 o’clock”. As a sidenote, even though the name ‘bust’ has certain negative connotations, it doesn’t always mean negative price movement. It should preferably be looked as a phase where price is moving at a slower pace.
Between 6 and 12, the market recovers and as more people notice the upswing and media coverage starts following the ‘boom’ story, the buying frenzy restarts and thus the cycle continues.
How long does a property cycle last for?
There’s no single property cycle in Australia. Different cities, property types and even regions are at varying stages of their own cycles. Shane Oliver, AMP Capital’s Chief Economist says in an interview with Michael Yardney that Australian capital city prices have had multiple cycles over the last 15 years with booms occurring around 2003, 2007, 2010 as well as recent years (CoreLogic). While some experts generalise property cycles to last between 7-10 years, it’s important to understand that this timeframe is changeable based on socioeconomic, political and other factors as we later discuss.
How do you know what ‘time’ it is on the property clock?
Figuring out what ‘time’ it is on the property clock in different regions can be difficult and quite subjective. Trying to pinpoint the exact nature of the property market is like trying to accurately predict the weather. There’s no single way to determine how the market will change in the future since past performance isn’t indicative of any future results. However, there are a few contributing factors that have commonly influenced movement in the cycle.
Monetary policy has historically been one of the most significant influencers of property market movement. The extended period of Reserve Bank (RBA) interest rate cuts is what sparked the most recent house price upswing in Sydney, with double-digit growth recorded in the September 2013 quarter. On the flipside, when the RBA increases rates to slow down the economy, booms are slowed.
Some factors that Performance Property Advisory (PPA) from BrickX’s Property Buying Team analyses:
- Property supply and demand (indicated by stock on market, vacancy rates, days on market and online visits per property
- Affordability
- Rental Yield
- Unemployment
So, what can you do as a prospective investor or homebuyer?
Research into the above factors could help you form an opinion on where different regions are sitting on the property clock – whether the market is reaching its peak or starting its downturn. It definitely takes a certain amount of bravery to move against the tide and be one of the few people prepared to do the opposite of everybody else. Keep your eyes peeled for our upcoming articles in our new end-of-month newsletter for some market updates from our property team!


good helpful article on the property clock
thanks Brickx !!!
and good news on the new fee structure too
Glad you like the article Ross- thanks for your continual support!