We’re pleased to share that our property portfolio has increased in value by +2.23% over the last 6 months to June 2018.
More notably, this result outperforms the 5 Capital City Average* which went down by -1.8%^ over the past 6 months.
These results validate that our approach to buying quality properties in established suburbs is delivering above market performance.
To keep you updated on how your investment is performing, every six months BrickX properties are independently valued.
A quick snapshot
Sydney
Our Sydney property portfolio, which consists of 11 properties, increased by +2.6% over the last 6 months to 30 June. This has outperformed the Sydney property market which went down by -2.6%^ over the same period.
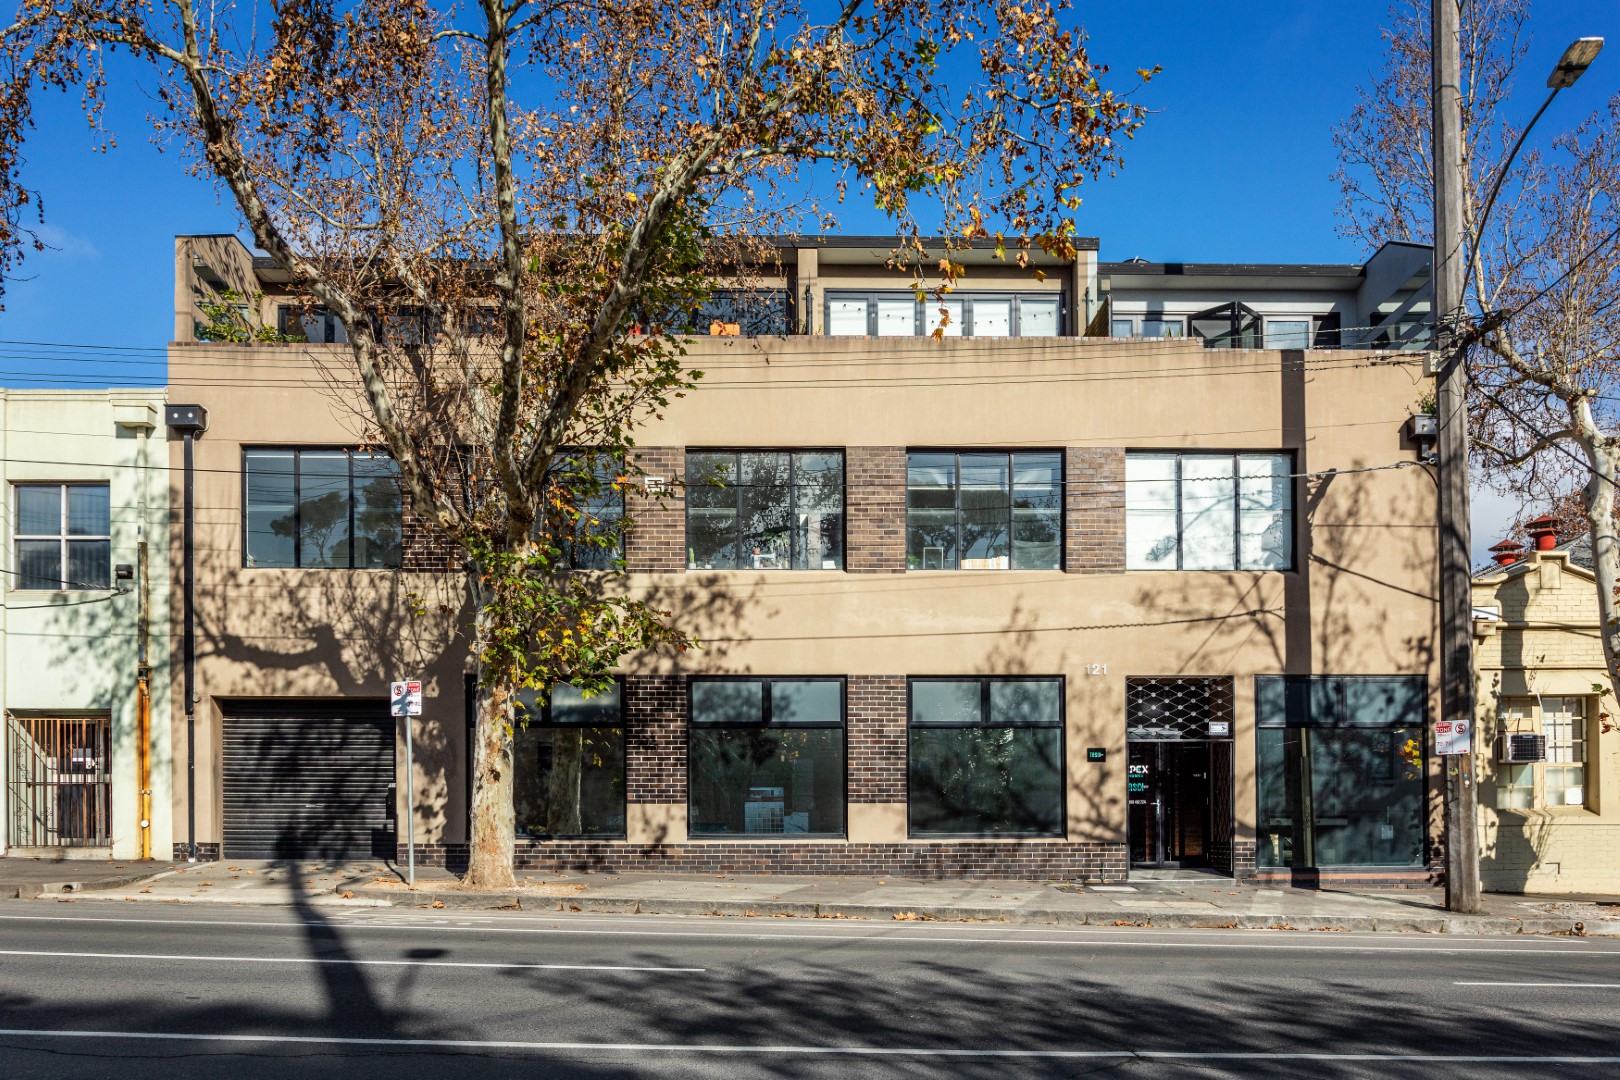
Melbourne
Our 3 properties in Melbourne returned an increase of +0.26% over the last 6 months, while the Melbourne property market went down by -1.8%^ over the same period.
Adelaide
Our property in St Peters increased in value by +6.05% over the last 6 months. This was significant compared to the Adelaide property market which increased by just +0.4%^ over the same period.
As the valuations of a number of properties increased, some Bricks may now be available below the updated Brick Value (we call this ‘Bricks below valuation’). These could represent an investment opportunity, depending on your objectives, financial situation and needs. See Bricks currently available for below their valuation or learn more about buying above and below valuation Bricks.
Remember to keep in mind that past performance is not indicative of future performance. Income and capital returns are not guaranteed. Investments in Bricks is generally for medium to long-term time horizons.
*CoreLogic’s 5 capital city data includes Sydney, Melbourne, Brisbane (inc. Gold Coast), Adelaide and Perth.
^CoreLogic Home Value Index
| Property | Initial Purchase Price (and property settlement date) | Previous Property Valuation (Dec 2017 or Initial Purchase Price) | Most Recent Independent Valuation of the Property (June 18) | % Change from prior valuation | Latest Brick Valuation (including unamortised acquisition costs and cash reserve) | |
| Enmore, NSW ENM01 |
$620,000 12/12/14 |
$660,000 | $670,000 | 1.52% | $68.75 | |
| Mosman, NSW MOS01 |
$1,200,000 23/01/15 |
$1,450,000 | $1,500,000 | 3.45% | $152.30 | |
| Prahran, VIC PRA01 |
$1,150,000 05/05/15 |
$1,190,000 | $1,190,000 | 0.00% | $122.90 | |
| Annandale, NSW ANN01 |
$1,270,000 06/11/15 |
$1,450,000 | $1,430,000 | -1.38% | $109.38 | |
| Double Bay, NSW DBB01 |
$1,305,000 21/10/16 |
$1,305,000 | $1,450,000 | 11.11% | $106.78 | |
| Bondi, NSW BND01 |
$1,350,000 02/12/16 |
$1,400,000 | $1,400,000 | 0.00% | $98.43 | |
| Port Melbourne, VIC PML01 |
$1,455,000 03/02/17 |
$1,455,000 | $1,455,000 | 0.00% | $154.01 | |
| Darlinghurst, NSW DAR01 |
$840,000 05/05/17 |
$840,000 | $840,000 | 0.00% | $55.74 | |
| Potts Point, NSW PPT01 |
$885,000 05/06/17 |
$885,000 | $885,000 | 0.00% | $64.80 | |
| Surry Hills, NSW SUR01 |
$1,300,000 29/05/17 |
$1,200,000 | $1,300,000 | 8.33% | $93.18 | |
| Brunswick West, VIC BRW01 |
$1,190,000 27/06/17 |
$1,190,000 | $1,200,000 | 0.84% | $97.83 | |
| Manly, NSW MAN01 |
$1,110,000 19/06/17 |
$1,110,000 | $1,140,000 | 2.70% | $88.54 | |
| St Peters, SA STP01 |
$825,100 17/07/17 |
$825,100 | $875,000 | 6.05% | $77.58 | |
| Balmain, NSW BLM01 |
$1,830,000 24/07/17 |
$1,830,000 | $1,830,000 | 0.00% | $137.87 | |
| Darlinghurst, NSW* DAR02 |
$639,000 13/04/18 |
n/a | n/a | n/a | $69.00 |
*Properties held for less than 6 months and therefore not valued independently at June 2018